flowchart LR
    A[Stats and Prob] --> B[Desc. Stats]
    A --> C[Distribtuions]
    A --> D[Population Inference]

    E[Data Exploration] --> F[Plotting]
    E --> G[Dataframes]
    E --> H[Exploratory Data Analysis]
CISC482 - Lecture24
The Recap
Dr. Jeremy Castagno
Class Business
Schedule
- Final Report - April 28 @ Midnight
- Final Presentation - May 5, Final
Today
- Part 1
- Part 2
- Part 3
- Part Future?
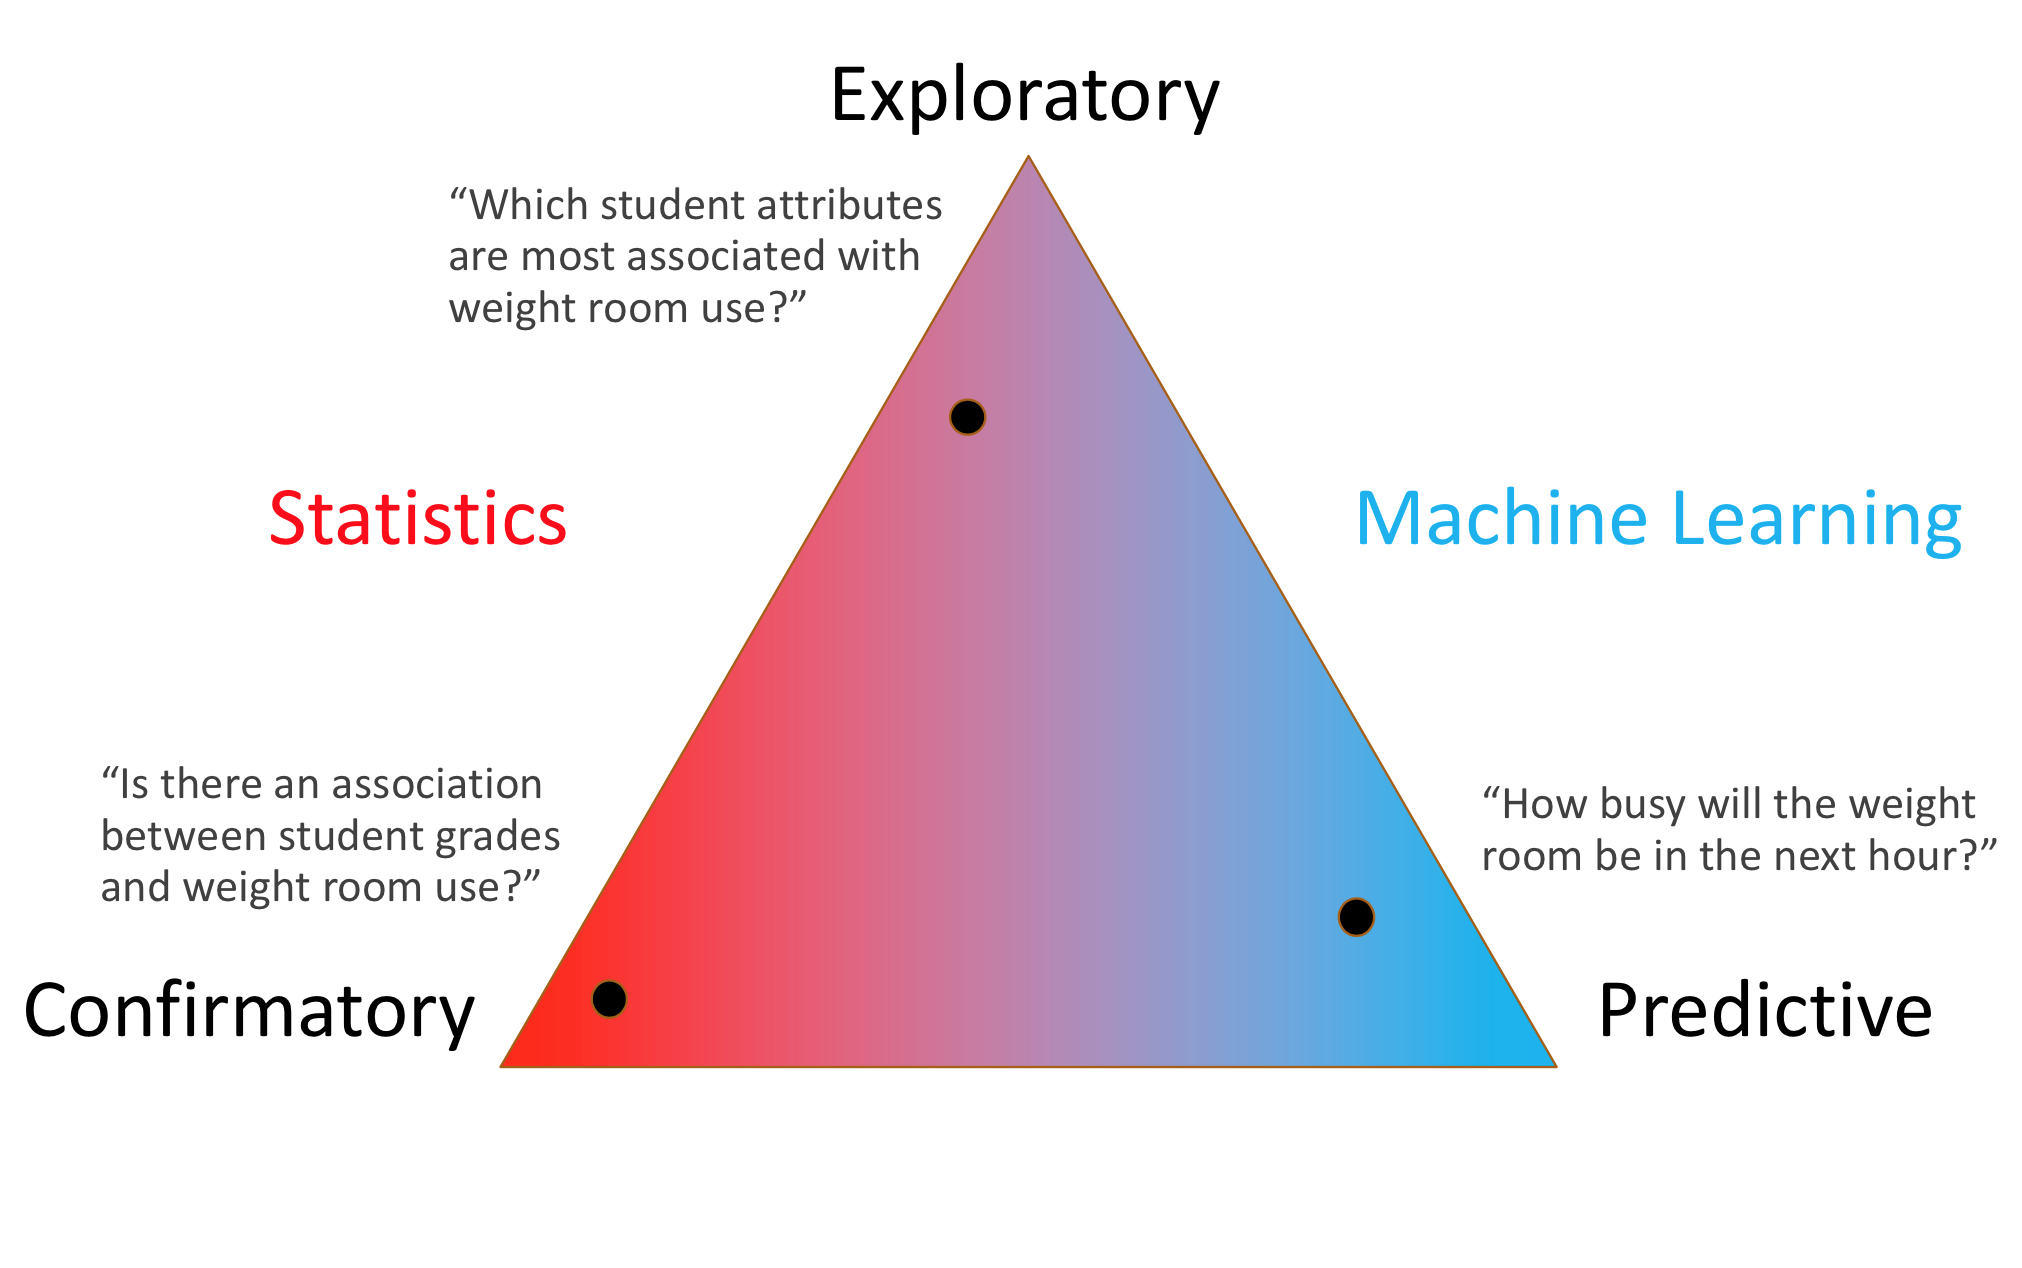
Triangle of Doom
Part 1 - Stats
Key Takeaways 1
- Data science relies on statistics to make data driven decisions
- Sampling methods are used to efeciently collect data and reduce bias
- We use descriptive statistics to describe our samples
- Measure of: center, spread, position, shape
Key Takeaways 2
- Inferential statistics are methods that result in conclusions and estimates about the population based on a sample
- Estimating a Population Mean with a CONFIDENCE INTERVAL
- Hypothesis Testing - Accepting or Rejecting the null hypthothesis
- Ducks on our lake have mean weigh of 1500 grams.
Key Takeaways 3
- Working with data is a multi step process
- We usually get a dataset as giant table. Often using a pandas dataframe
- Each row is sample, the columns are the features for that sample
- We first do Exploratory Data Analsyis (EDA)
- Trying to understand our data.
- What is the sahpe of these features. How are they realted
Key Takeaways 3 (Continued)
- We also
- clean
- enrich
- validate
- This preps us to start creating models for prediction
Part 2 - Regression, Evaluation
flowchart LR
    A[Regression] --> B[Linear Regression]
    A --> C[Mutliple Linear Regression]
    A --> D[Polynomial Regression]
    A --> Z[Logistic Regression]

    E[Model Evaluation] --> F[RMSE, R^2]
    E --> G[Precision, Recall]
    E --> H[Train,Valid,Test ]
Key Takeaways 1
- An input feature, \(X\), is used to predict …
- an output feature has values that vary in response to variation in some other feature(s).
- We often called this the response variable
- If the output feature is continous, we call this a regression
Key Takeaways 2
- Set of data: \(\{(x_1, y_1), (x_2, y_2), ..., (x_n, y_n)\}\)
- x: input, y: output
- Model: \(\hat{y} = \beta_0 + \beta_1 x + \epsilon\)
- \(\hat{y}\) = prediction
- \(\beta_0\) = y-intercept
- \(\beta_1\) = slope
- \(\epsilon = error\)
- \(\beta_1 (slope) = \frac{\sum\limits_{i=1}^{n}[(x_i-\bar{x})(y_i- \bar{y})]}{\sum\limits_{i=1}^{n} (x_i - \bar{x})^2}\)
- \(\beta_0\) (intercept) - \(\bar{y} - \beta_1 \bar{x}\)
Key Takeaways 3
- Assumption of Linear Regression
- \(x\) and \(y\) have a linear relationship.
- The residuals of the observations are independent.
- The mean of the residuals is 0 and the variance of the residuals is constant.
- The residuals are approximately normally distributed.
Key Takeaways 3
- \(R^2\) and RMSE for Regression model evaluation
- Precison, Recall, F1 Score for Classification Evaluation
Key Takeaways 4
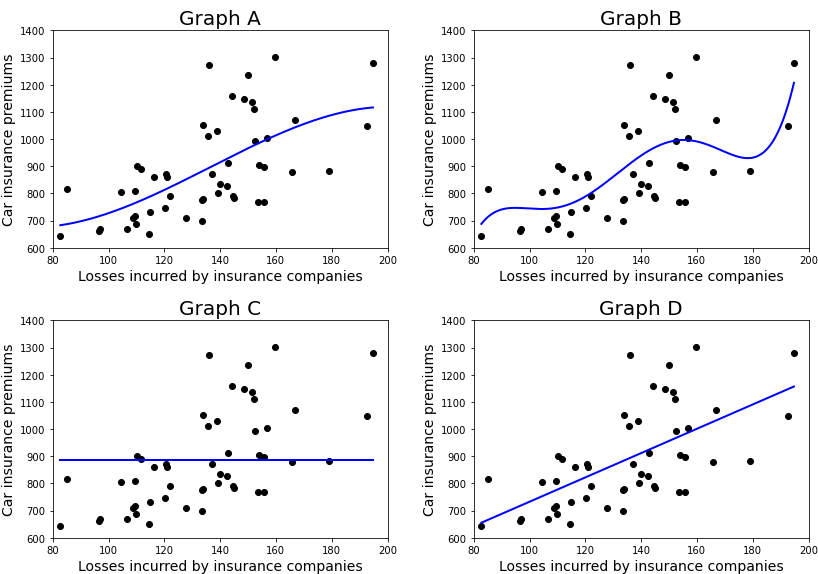
- Underfit - model is too simple to fit the data well.
- Overfit - model is too complex to fit the data well.
Key Takeaways 5
- Training data is used to fit a model.
- Use this dataset to do K-Fold Cross Validation
- Test data is used to evaluate final model performance and compare different models.
- The ratio for this split: 80/20 or 70/30


Part 3 - Supervised and Unsupervised Learning
flowchart LR
    A[Supervised Learning] --> B[Linear Regression]
    A --> C[KNN]
    A --> D[Naive Bayes]
    A --> Z[SVM]

    E[Unsupervised Learning] --> F[Clustering]
    F --> I[K-Means]
    F --> J[AHC]
    E --> G[PCA]
Key Takeaways 1
- Regression - Given \(x_1, x_2, ..., x_n\), predict a continous output, \(y\)
- Classification - Given \(x_1, x_2, ..., x_n\), predict a grouping/class, \(y\)
- Regression
- Linear Regression (Multiple, Polynomial, etc)
- K Nearest Neighbro (KNN)
- We use the library
sklearnto build our models for us.
Key Takeaways 2
- Logistic Regression works great for simple linear classifications
- SVM are awesome and can do non-linear seperations. But you need to try different hyperparemters
- Kernel - rpf, polynomial, linear
- Try C - Try 0.0001 -> 10_000

Key Takeaways 3
- K-Means clustering work for only easy clustering problems
- If you clusters have compicated shapes or densities, stick with AHC or DBScan
Key Takeaways 4
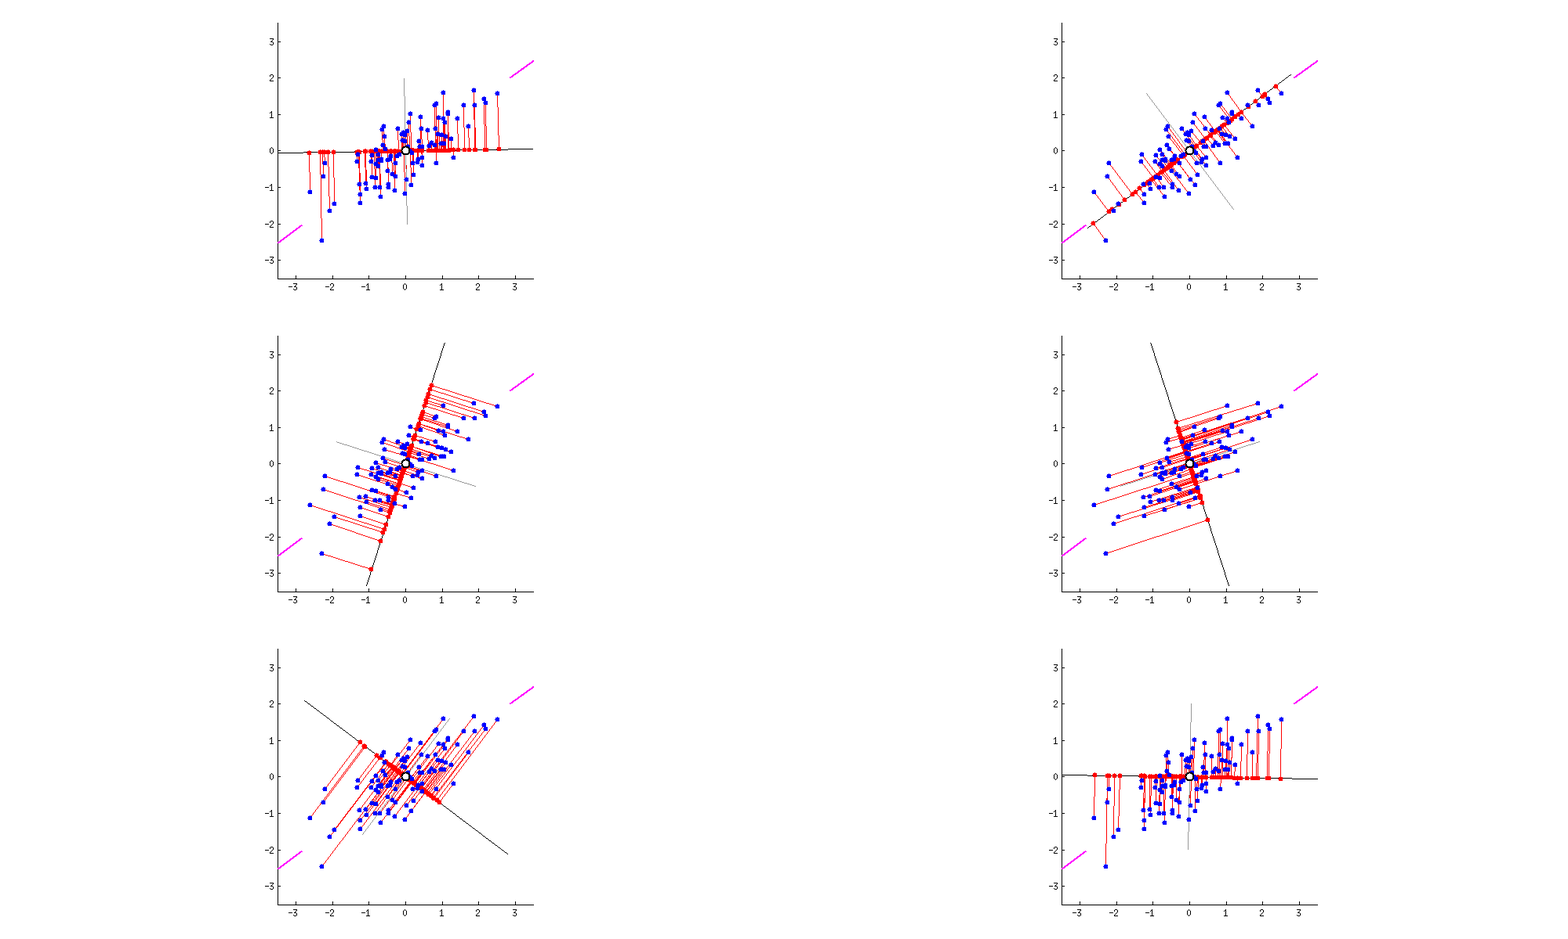
- Principal component analysis, or PCA, is a dimensionality reduction technique.
- It can be used to compress data.
Final Words
Happy
- I have really enjoyed teaching this course, I hope you enjoyed taking it!
What are some concepts that were completely new to you in this course?
Future
- Data science, machine learning, and artificial intelligence are not going anywhere
- This course has laid a small foundation for you to build upon.
- Many jobs are becoming automated or enhanced by AI and Machine Learning.
- In order to stay competitive in the workforce, you should have a basic understanding of these technologies and learn how to use them.
The rise of AI
- Large Language Models (ChatGPT) and AI image Generation (Midjourney) are the start of big changes to come
- Jobs - Writing/Journalism, Digital Artists, Even Junior coding jobs
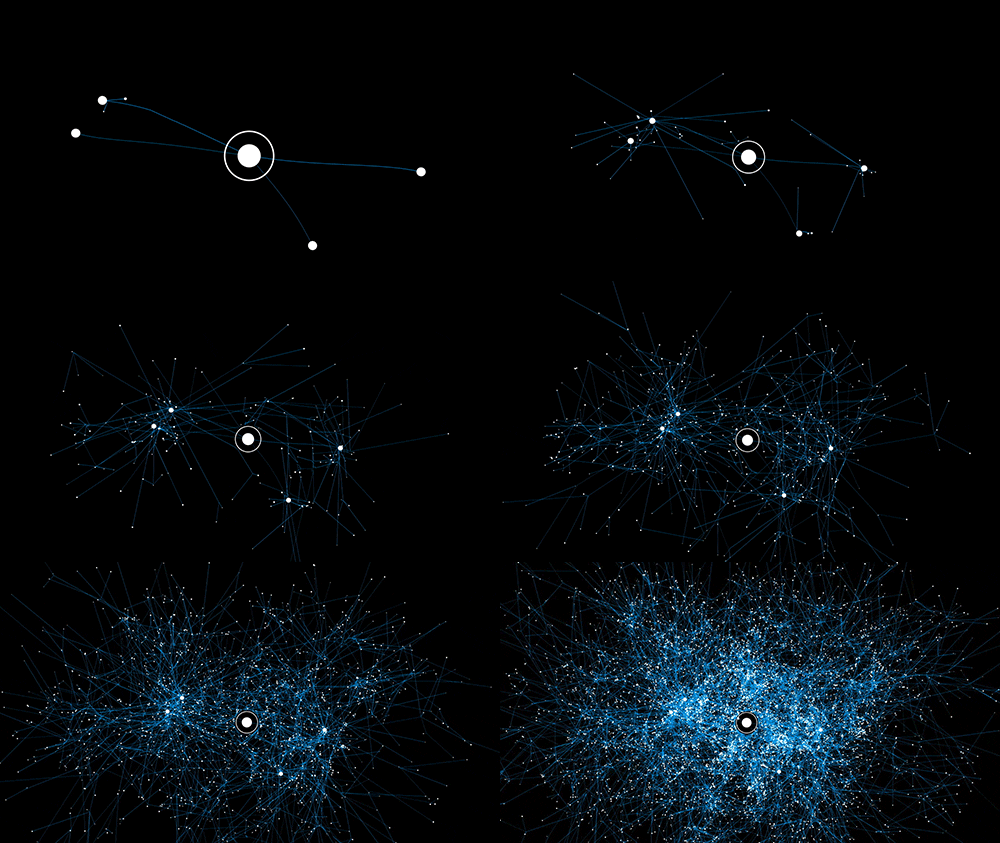
You have the skills!
- You have more understanding of how AI works than most others
- Its just pattern matching. Thats it. Features come in, we apply some mathematical models, response variables come out.
- There is a bright future ahead of you! Even if you dont pursue data science, you are now more prepared to use their tools effectively!
