Code
<Axes: >
Principal Component Analysis
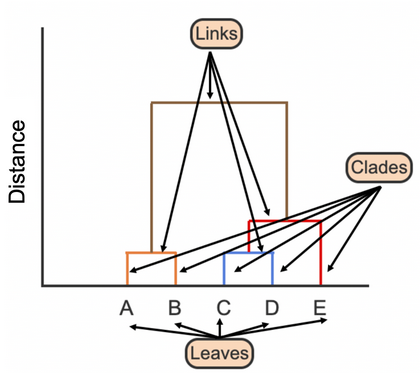
Which two samples should be used to determine similarity using the Single linkage? Complete Linkage?
Which two samples should be used to determine similarity using the Single linkage? Complete Linkage?

Find me a vector or axis that when you project the data to it maximizes the variance
x = np.arange(0, 10) + np.random.randn(10) * 0.1
y = np.arange(0, 10) + np.random.randn(10) * 0.1
z = x * 1 + y * 2 + np.random.randn(10) * 1
fig = plt.figure()
ax = fig.add_subplot(projection='3d')

X = np.column_stack([x, y, z])

ax.scatter(x, y, z, marker='o')
ax.set_xlabel('X Label')
ax.set_ylabel('Y Label')
ax.set_zlabel('Z Label')
Text(0.5, 0, 'Z Label')
from sklearn.decomposition import PCA
pca = PCA(n_components=1)
# fit and transform data
X_pca = pca.fit_transform(X)
print(X_pca.shape)
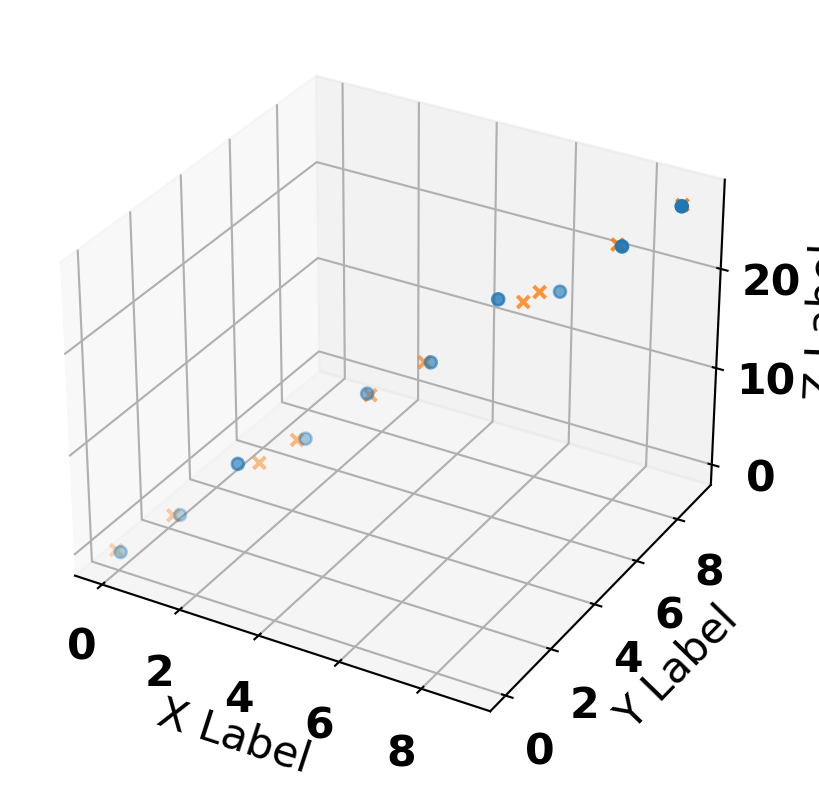
X_comp = pca.inverse_transform(X_pca)

fig = plt.figure()
ax = fig.add_subplot(projection='3d')

ax.scatter(x, y, z, marker='o', label='Raw')
ax.scatter(X_comp[:, 0], X_comp[:, 1], X_comp[:, 2], marker='x', label='compressed')
ax.set_xlabel('X Label')
ax.set_ylabel('Y Label')
ax.set_zlabel('Z Label')
(10, 1)Text(0.5, 0, 'Z Label')
Features: ['Alcohol', 'Malic acid', 'Ash', 'Alcalinity of ash', 'Magnesium', 'Total phenols', 'Flavanoids', 'Nonflavanoid phenols', 'Proanthocyanins', 'Color intensity', 'Hue', 'OD280/OD315 of diluted wines', 'Proline']
Classes: (array([1, 2, 3]), array([59, 71, 48]))| group | 1 | 2 | 3 | 4 | 5 | 6 | 7 | 8 | 9 | 10 | 11 | 12 | 13 | |
|---|---|---|---|---|---|---|---|---|---|---|---|---|---|---|
| 0 | 1 | 14.23 | 1.71 | 2.43 | 15.60 | 127 | 2.80 | 3.06 | 0.28 | 2.29 | 5.64 | 1.04 | 3.92 | 1065 |
| 1 | 1 | 13.20 | 1.78 | 2.14 | 11.20 | 100 | 2.65 | 2.76 | 0.26 | 1.28 | 4.38 | 1.05 | 3.40 | 1050 |
| 2 | 1 | 13.16 | 2.36 | 2.67 | 18.60 | 101 | 2.80 | 3.24 | 0.30 | 2.81 | 5.68 | 1.03 | 3.17 | 1185 |
| 3 | 1 | 14.37 | 1.95 | 2.50 | 16.80 | 113 | 3.85 | 3.49 | 0.24 | 2.18 | 7.80 | 0.86 | 3.45 | 1480 |
| 4 | 1 | 13.24 | 2.59 | 2.87 | 21.00 | 118 | 2.80 | 2.69 | 0.39 | 1.82 | 4.32 | 1.04 | 2.93 | 735 |
Can we visualize this data? Why or why not?
from sklearn.preprocessing import StandardScaler

df_train, df_test = train_test_split(
    df, test_size=0.30, random_state=0)

y_train = df_train['group']
y_test = df_test['group']

scaler = StandardScaler().set_output(transform="pandas")
scaled_X_train = scaler.fit_transform(df_train.iloc[:, 1:])
scaled_X_test = scaler.fit_transform(df_test.iloc[:, 1:])
scaled_X_train.head()| x0 | x1 | x2 | x3 | x4 | x5 | x6 | x7 | x8 | x9 | x10 | x11 | x12 | |
|---|---|---|---|---|---|---|---|---|---|---|---|---|---|
| 22 | 0.91 | -0.46 | -0.01 | -0.82 | 0.06 | 0.59 | 0.94 | -0.76 | 0.13 | -0.51 | 0.66 | 1.94 | 0.94 |
| 108 | -0.96 | -0.97 | -1.54 | -0.15 | -0.55 | 0.17 | 0.07 | 0.21 | 0.78 | -0.98 | -0.41 | 0.58 | -1.41 |
| 175 | 0.36 | 1.68 | -0.37 | 0.13 | 1.36 | -1.12 | -1.31 | 0.53 | -0.44 | 2.22 | -1.56 | -1.45 | 0.29 |
| 145 | 0.22 | 1.05 | -0.77 | 0.41 | 0.13 | -1.27 | -1.46 | 0.53 | -0.52 | -0.43 | -1.52 | -1.28 | 0.27 |
| 71 | 1.10 | -0.77 | 1.11 | 1.54 | -0.96 | 1.16 | 0.92 | -1.25 | 0.43 | -0.69 | 1.72 | 0.78 | -1.09 |
\(z = (x - \mu) / \sigma\)
[[2.6 -0.0]
 [0.2 2.3]
 [-2.6 -2.7]
 [-2.5 -0.5]
 [1.7 0.9]
 [-2.8 -0.4]
 [-2.8 -2.0]
 [1.4 -0.0]
 [-2.5 0.1]
 [-2.3 0.4]
 [1.1 2.4]
 [-2.3 1.1]
 [-2.5 -0.6]
 [0.2 1.1]
 [2.5 -1.1]
 [-0.7 2.8]
 [2.5 0.2]
 [-0.6 0.7]
 [0.5 -0.4]
 [3.6 -1.4]
 [1.6 1.5]
 [2.5 0.1]
 [-3.6 -0.9]
 [-1.6 -2.4]
 [1.5 1.4]
 [0.0 2.0]
 [-0.2 2.8]
 [-2.4 -2.5]
 [-3.1 0.3]
 [3.3 -0.4]
 [-3.5 -1.8]
 [-0.5 2.6]
 [-0.6 2.0]
 [-1.2 0.8]
 [1.0 1.4]
 [2.0 1.6]
 [2.8 -1.9]
 [2.1 -1.3]
 [0.8 2.0]
 [3.5 -1.4]
 [-3.8 -0.1]
 [1.7 0.5]
 [-3.4 -0.9]
 [3.1 -0.8]
 [2.3 -1.7]
 [1.3 0.9]
 [3.6 -1.8]
 [0.9 2.3]
 [0.5 2.0]
 [3.8 -2.9]
 [-2.4 -2.2]
 [-1.6 1.4]
 [2.5 -1.3]
 [-0.7 0.2]
 [-0.8 2.4]
 [0.8 1.5]
 [-1.3 -0.0]
 [2.2 -0.9]
 [-3.9 -0.5]
 [-1.8 -1.3]
 [4.4 -2.3]
 [3.3 -1.4]
 [-1.5 1.9]
 [-2.7 -2.2]
 [2.8 -1.4]
 [1.9 -0.7]
 [-0.5 2.2]
 [-0.1 1.2]
 [2.0 -0.2]
 [2.2 -1.3]
 [0.8 -0.3]
 [-3.3 -2.2]
 [0.9 0.8]
 [2.3 0.1]
 [0.8 1.4]
 [-2.3 -0.6]
 [3.1 -1.3]
 [-1.7 1.8]
 [-2.9 -0.2]
 [-2.7 -0.3]
 [1.9 -1.6]
 [1.6 0.6]
 [-2.0 -0.3]
 [2.3 -1.9]
 [-2.3 -0.2]
 [-0.4 2.0]
 [1.4 -0.7]
 [2.2 -0.7]
 [-0.4 1.9]
 [2.8 -1.5]
 [-2.8 -1.9]
 [-1.6 1.4]
 [-3.4 -1.1]
 [1.7 -0.1]
 [-2.9 -0.4]
 [-2.3 -2.2]
 [-3.5 -1.3]
 [2.3 -0.3]
 [1.5 2.1]
 [-0.4 2.4]
 [0.4 1.1]
 [0.5 3.9]
 [-2.7 -1.6]
 [-3.2 -2.7]
 [-0.6 1.0]
 [-1.4 1.5]
 [0.9 -0.7]
 [1.1 1.3]
 [-2.8 -1.3]
 [-2.4 -2.4]
 [2.5 -1.9]
 [3.2 -1.8]
 [-2.7 -0.2]
 [-1.1 1.8]
 [-1.5 1.0]
 [-0.5 2.5]
 [1.4 -0.7]
 [1.1 -0.2]
 [2.8 -1.0]
 [-0.5 2.6]
 [0.3 2.3]
 [-0.1 2.0]
 [2.9 -0.8]
[-2.4 -2.2]]from sklearn.inspection import DecisionBoundaryDisplay
from sklearn.linear_model import LogisticRegression
model = LogisticRegression(C=1e5)
model.fit(X_train_pca, y_train)
disp = DecisionBoundaryDisplay.from_estimator(
model, X_train_pca, response_method="predict", cmap=plt.cm.viridis, alpha=0.5, xlabel='PC1', ylabel='PC2'
)
disp.ax_.scatter(X_train_pca[:, 0], X_train_pca[:,1], c=y_train, cmap='viridis', edgecolor='k');
PC1 : [0.1 -0.2 -0.0 -0.3 0.1 0.4 0.4 -0.3 0.3 -0.1 0.3 0.4 0.3]from sklearn.datasets import load_digits
mnist = load_digits()
X = mnist.data
y = mnist.target
images = mnist.images
fig, axes = plt.subplots(2, 10, figsize=(16, 6))
for i in range(20):
axes[i//10, i %10].imshow(images[i], cmap='gray');
axes[i//10, i %10].axis('off')
axes[i//10, i %10].set_title(f"target: {y[i]}")
plt.tight_layout()
| 0 | 1 | 2 | 3 | 4 | 5 | 6 | 7 | 8 | 9 | ... | 54 | 55 | 56 | 57 | 58 | 59 | 60 | 61 | 62 | 63 | |
|---|---|---|---|---|---|---|---|---|---|---|---|---|---|---|---|---|---|---|---|---|---|
| 0 | 0.00 | 0.00 | 5.00 | 13.00 | 9.00 | 1.00 | 0.00 | 0.00 | 0.00 | 0.00 | ... | 0.00 | 0.00 | 0.00 | 0.00 | 6.00 | 13.00 | 10.00 | 0.00 | 0.00 | 0.00 |
| 1 | 0.00 | 0.00 | 0.00 | 12.00 | 13.00 | 5.00 | 0.00 | 0.00 | 0.00 | 0.00 | ... | 0.00 | 0.00 | 0.00 | 0.00 | 0.00 | 11.00 | 16.00 | 10.00 | 0.00 | 0.00 |
| 2 | 0.00 | 0.00 | 0.00 | 4.00 | 15.00 | 12.00 | 0.00 | 0.00 | 0.00 | 0.00 | ... | 5.00 | 0.00 | 0.00 | 0.00 | 0.00 | 3.00 | 11.00 | 16.00 | 9.00 | 0.00 |
| 3 | 0.00 | 0.00 | 7.00 | 15.00 | 13.00 | 1.00 | 0.00 | 0.00 | 0.00 | 8.00 | ... | 9.00 | 0.00 | 0.00 | 0.00 | 7.00 | 13.00 | 13.00 | 9.00 | 0.00 | 0.00 |
| 4 | 0.00 | 0.00 | 0.00 | 1.00 | 11.00 | 0.00 | 0.00 | 0.00 | 0.00 | 0.00 | ... | 0.00 | 0.00 | 0.00 | 0.00 | 0.00 | 2.00 | 16.00 | 4.00 | 0.00 | 0.00 |
| ... | ... | ... | ... | ... | ... | ... | ... | ... | ... | ... | ... | ... | ... | ... | ... | ... | ... | ... | ... | ... | ... |
| 1792 | 0.00 | 0.00 | 4.00 | 10.00 | 13.00 | 6.00 | 0.00 | 0.00 | 0.00 | 1.00 | ... | 4.00 | 0.00 | 0.00 | 0.00 | 2.00 | 14.00 | 15.00 | 9.00 | 0.00 | 0.00 |
| 1793 | 0.00 | 0.00 | 6.00 | 16.00 | 13.00 | 11.00 | 1.00 | 0.00 | 0.00 | 0.00 | ... | 1.00 | 0.00 | 0.00 | 0.00 | 6.00 | 16.00 | 14.00 | 6.00 | 0.00 | 0.00 |
| 1794 | 0.00 | 0.00 | 1.00 | 11.00 | 15.00 | 1.00 | 0.00 | 0.00 | 0.00 | 0.00 | ... | 0.00 | 0.00 | 0.00 | 0.00 | 2.00 | 9.00 | 13.00 | 6.00 | 0.00 | 0.00 |
| 1795 | 0.00 | 0.00 | 2.00 | 10.00 | 7.00 | 0.00 | 0.00 | 0.00 | 0.00 | 0.00 | ... | 2.00 | 0.00 | 0.00 | 0.00 | 5.00 | 12.00 | 16.00 | 12.00 | 0.00 | 0.00 |
| 1796 | 0.00 | 0.00 | 10.00 | 14.00 | 8.00 | 1.00 | 0.00 | 0.00 | 0.00 | 2.00 | ... | 8.00 | 0.00 | 0.00 | 1.00 | 8.00 | 12.00 | 14.00 | 12.00 | 1.00 | 0.00 |
1797 rows × 64 columns


pca = PCA(n_components=64)
pca_data = pca.fit_transform(X)
percentage_var_explained = pca.explained_variance_ / np.sum(pca.explained_variance_)
cum_var_explained = np.cumsum(percentage_var_explained) * 100

plt.plot(range(1,65), cum_var_explained, linewidth=2)
plt.xlabel("Number of Components")
plt.ylabel("Cumulative Variance Explained");
plt.xticks(np.arange(0, 64, 4));
plt.ylim(0,100);


