CISC482 - Lecture10

Regression

Dr. Jeremy Castagno

Class Business

Schedule

  • Topic Ideas - Feb 22 @ Midnight
  • Reading 5-1: Feb 22 @ 12PM, Wednesday
  • Reading 5-2: Feb 24 @ 12PM, Friday
  • Reading 5-3: Mar 01 @ 12PM, Wednesday

Today

  • Introduction to Regression
  • Review Topic Ideas
  • More Exploratory Data Analysis

Introduction to Regression

Input and Output

  • An input feature takes values without being impacted by any other features.
  • An output feature has values that vary in response to variation in some other feature(s).
    • We often called this the response variable
  • In an experiment, input features are often controlled by researchters, and output features are observed
  • We often visualize these with scatter plots

Example Data

species island bill_length_mm bill_depth_mm flipper_length_mm body_mass_g sex year
0 Adelie Torgersen 39.10 18.70 181.00 3,750.00 male 2007
1 Adelie Torgersen 39.50 17.40 186.00 3,800.00 female 2007
2 Adelie Torgersen 40.30 18.00 195.00 3,250.00 female 2007
3 Adelie Torgersen NaN NaN NaN NaN NaN 2007
4 Adelie Torgersen 36.70 19.30 193.00 3,450.00 female 2007

Scatter Plot

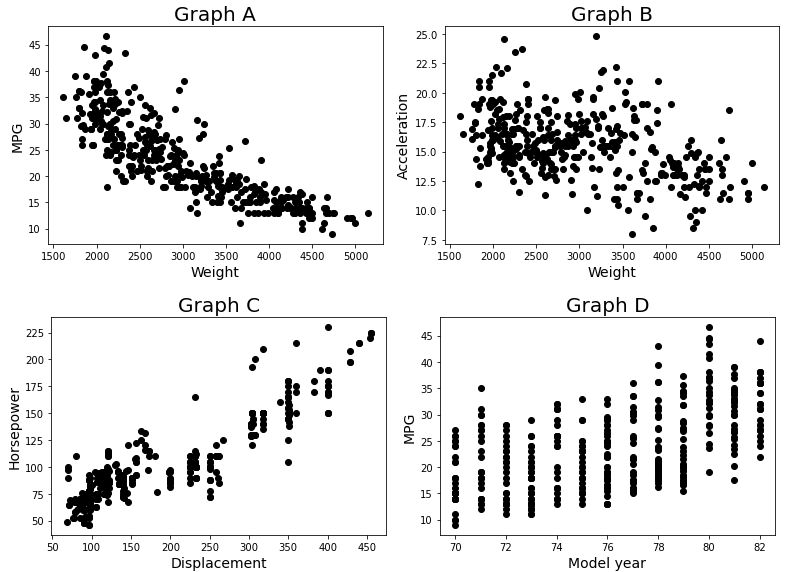
Correlation: 0.60

Describing

  • The direction: positive if larger values of one feature correspond to larger values of the other feature.
  • The form: linear pattern or a nonlinear pattern. Sometimes two features may not have an obvious form.
  • The strength: how closely the observations in a scatter plot follow the form’s pattern.

Questions

Correlation

  • Correlation is a statistical measure that expresses the extent to which two variables are linearly related
  • They change together at a constant rate
  • It’s a common tool for describing simple relationships without making a statement about cause and effect.
  • Range from -1 to 0 to +1

Regression Model

  • A model for an output feature \(y\) using input feature(s) \(X\) is a function \(f(X)\) that predicts an expected value \(\hat{y}\) for a given value of \(X\).and
  • \(\hat{y} = f(X)\)
  • A regression model is one that has a numerical output feature and input features.

Regression Example

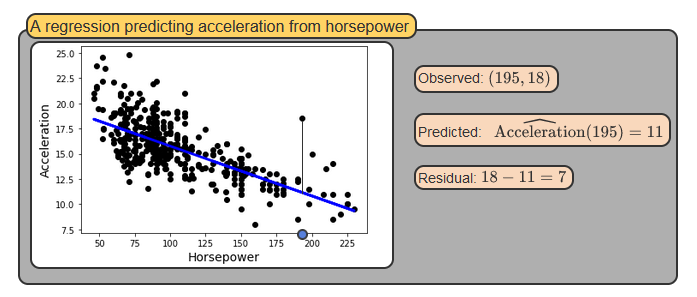
  • What is the error of our model (Residual)

Simple Linear Regression

Main Equation

  • Set of data: \(\{(x_1, y_1), (x_2, y_2), ..., (x_n, y_n)\}\)
    • x: input, y: output
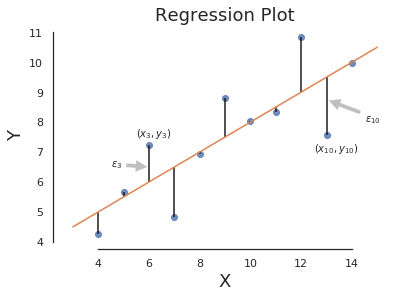
  • Model: \(\hat{y} = \beta_0 + \beta_1 x + \epsilon\)
    • \(\hat{y}\) = prediction
    • \(\beta_0\) = y-intercept
    • \(\beta_1\) = slope
    • \(\epsilon = error\)

Visual Explanation

Tip

How can we formalize what we are optimizing for?

Formulation

  • We want to find the \(\beta_0\) and \(\beta_1\) parameters that reduce the combined error.
  • A loss function that takes as input our parameters and whose output is our model error.
  • \(f(\beta_0, \beta_1) = \sum\limits_{i=1}^{n}[y_i - \hat{y}_i]^2 = \sum\limits_{i=1}^{n}\epsilon_i^2\)
  • Sum of the Squared Residuals (SSR/SSE). Big or small?

\[ SSR = \sum\limits_{i=1}^{n}[y_i - \hat{y}_i]^2 = [y_i - (\hat{\beta}_0 + \hat{\beta}_1 x_i)]^2 \\ = [y_i - \hat{\beta}_0 - \hat{\beta}_1 x_i]^2 \]

Derivation

  • Will not be going through the derivation
  • Basic idea is take the partial derivaitve of the funciton with respect to the parameters and set equal to 0.
  • Do a bunch of algebra and you arrive at some nice equations
  • Full derivation is here and here

Classic Stats Result

  • \(\beta_1 (slope) = \frac{\sum\limits_{i=1}^{n}[(x_i-\bar{x})(y_i- \bar{y})]}{\sum\limits_{i=1}^{n} (x_i - \bar{x})^2}\)
  • \(\beta_0\) (intercept) - \(\bar{y} - \beta_1 \bar{x}\)
df_r = df[['bill_length_mm', 'body_mass_g']].dropna()
x = df_r.bill_length_mm
y = df_r.body_mass_g
x_bar = x.mean()
y_bar = y.mean()
print(f"Xbar: {x_bar:.1f}")
print(f"Ybar: {y_bar:.1f}")
Xbar: 43.9
Ybar: 4201.8

Computation

numerator = np.sum((x - x_bar) * (y - y_bar))
denominator = np.sum((x - x_bar)**2)
slope = numerator / denominator
intercept = y_bar - slope * x_bar
print(f"Slope: {slope:.1f}; \nIntercept: {intercept:.1f}");
Slope: 87.4; 
Intercept: 362.3

Another Classic Stats Result

\[ \begin{aligned}\hat{\beta}_1 &= \frac{\text{Cov}(x,y)}{s_x^2}\end{aligned} \]

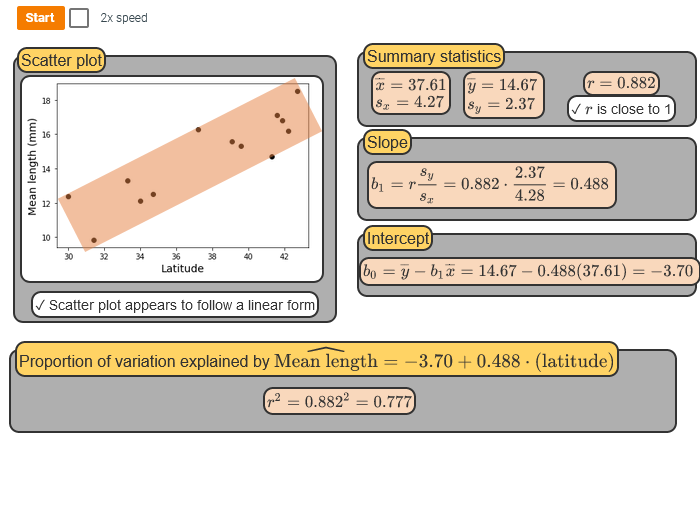
The correlation between \(x\) and \(y\) is \(r = \frac{\text{Cov}(x,y)}{s_x s_y}\). Thus, \(\text{Cov}(x,y) = r s_xs_y\). Plugging this into above, we have

\[ \hat{\beta}_1 = \frac{\text{Cov}(x,y)}{s_x^2} = r\frac{s_ys_x}{s_x^2} = r\frac{s_y}{s_x} \]

\(\beta_0\) (intercept) - \(\bar{y} - \beta_1 \bar{x}\)

Computation

r = df_r.bill_length_mm.corr(df_r.body_mass_g)
slope = r * (df_r.body_mass_g.std() / df_r.bill_length_mm.std())
intercept = y_bar - slope * x_bar
print(f"Slope: {slope:.1f}; \nIntercept: {intercept:.1f}")
Slope: 87.4; 
Intercept: 362.3

Another Full Example

Matrix Math Result

\[ \begin{align*} A = \begin{bmatrix} x_1 & 1\\ x_2 & 1 \\ ... & ... \\ x_n & 1 \end{bmatrix} \qquad y = \begin{bmatrix} y_1 \\ y_2 \\ ... \\ y_n \end{bmatrix} \end{align*} \qquad \beta = \begin{bmatrix} \beta_0 \\ \beta_1 \end{bmatrix} \]

\[ \hat{y_1} = x_1 \cdot \beta_0 + 1 \cdot \beta_1 \\ ... \\ \hat{y} = A \beta \]

\[ \beta = \begin{bmatrix} \beta_0 \\ \beta_1 \end{bmatrix} = (A^TA)^{-1} A^Ty \]

Computation of Matrix Result

n = len(df_r)
print(x.shape, type(x))
x = x.values
print(x.shape,type(x))
x = np.expand_dims(x, axis=1) # convert to matrix
print(x.shape)
A = np.append(x, np.ones(shape=(n, 1)), axis=1) # add one column
print(A.shape)
y = y.values
print(x[:5, :]) # sample of matrix
# intercept = y_bar - slope * x_bar
# print(f"Slope: {slope:.1f}; \nIntercept: {intercept:.1f}")
(342,) <class 'pandas.core.series.Series'>
(342,) <class 'numpy.ndarray'>
(342, 1)
(342, 2)
[[39.1]
 [39.5]
 [40.3]
 [36.7]
 [39.3]]

Computation of Matrix Result

beta = np.linalg.inv(A.T @ A) @ A.T @ y
print(f"Slope: {beta[0]:.1f}; \nIntercept: {beta[1]:.1f}")
Slope: 87.4; 
Intercept: 362.3

Class Activity

Class Activity

Practice Regression