CISC482 - Lecture09

Exploratory Data Analysis

Dr. Jeremy Castagno

Class Business

Schedule

  • Reading 5-1: Feb 22 @ 12PM, Wednesday
  • Reading 5-2: Feb 24 @ 12PM, Friday
  • Topic Ideas - Feb 22 @ Midnight

Today

  • Review Exam
  • Review Topic Ideas
  • More Exploratory Data Analysis

Exam Review

Most Missed Questions

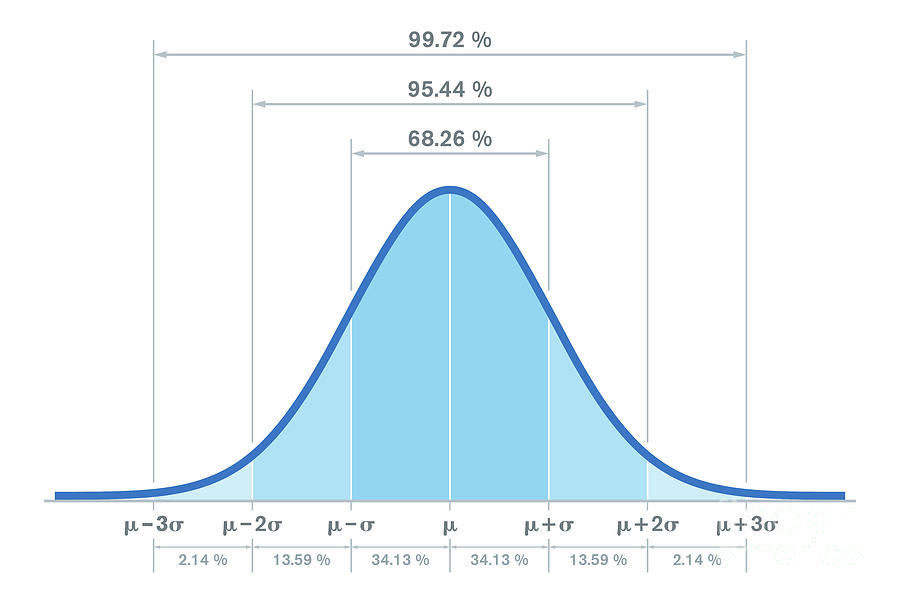
  • Student spending at bookstore is normally distributed with a mean of $130 and a standard deviation of $30. Approximately what percentage of students spend less than $100 a month. Options: - 16, 20, 33, 50
  • Springfield College wants to give gift cards to the top 3% of spenders. What should be monthly spending cutoff to determine which students get gift cards?
    • 130, 160, 186, 220
  • Hypothesis Testing, p-value of 0.01, using 95% confidence when making a decison to reject or accept null hypothesis.

Normal Distribution

Normal Distribution Solution

  • 50% of students spend more than 130. 34% of students spend between 100 and 130. Thefore 50+34=84% students spend more than 100. Thefore 100-84=16% students spend less than 100.
  • 50% of students spend at least 130. Roughly 34+14=48% of students spend between 130 and 190 dollars. Thefore 50+48=98% students spend less than 190. Thefore the top 2% spends 190 or more. If we want the top 3% it will be must a little less. Looking at the options 186 is the best one.

Hypothesis Testing Solution

  • Reject null hypothesis when p-value is less than 0.05 and accept the alternative hypothesis.

Topic Ideas

Purpose

  • Find 2-3 datasets that you are interested and are connected to your core signature assignments
  • Verify the data is suitable for analysis
  • Practice writing concisely and clearly about complex topics

Requirements

  • Data Requirements
  • Paper Requirements

Data Requirements

  • At least 100 observations
  • At least 8 columns
  • At least 6 of the columns must be useful and unique predictor variables.
  • At least one variable that can be identified as a reasonable response variable
    • The response variable can be quantitative or categorical.
  • Observations should reasonably meet the independence condition.

Paper Requirements

  • Introduction
  • Research Question
  • Glimpse of Data

Introduction Section

  • State source of data
  • Describe when and how it was originally collected (by the original data curator, not necessarily how you found the data).
  • Describe the observations and the general characteristics being measured in the data.
  • Describe how the data set connect to your Core Studies.

Research Question

  • Describe a research question you’re interested in answering using this data
  • Can you accurately predict whether a person will survive in the titanic data set? What features would be most important to make that prediction?

Glimpse of Data

  • Please print out the results of the info() function of the dataframe
  • Also print out the first few rows of data head()

Example Template

  • Brightspace assignment
  • Link to template to follow
  • Copy and put in your shared google drive folder
  • Print PDF and submit to brightspace

Exploratory Data Analysis (EDA)

Steps

  1. Understand the Data
    1. Size of the dataset (rows,cols), features (categorical, numerical).
  2. Identify Relationships between features
    1. Direction and strength of correlation
  3. Describe the shape of the data
    1. Symmetric, Skewed
  4. Detect outliers and missing values
    1. Box an Whisker!

Understand the Data

  • Number of Rows, Columns?
  • What features are categorical vs numeric?
  • Any missing data?

Example Data

<class 'pandas.core.frame.DataFrame'>
RangeIndex: 344 entries, 0 to 343
Data columns (total 8 columns):
 #   Column             Non-Null Count  Dtype  
---  ------             --------------  -----  
 0   species            344 non-null    object 
 1   island             344 non-null    object 
 2   bill_length_mm     342 non-null    float64
 3   bill_depth_mm      342 non-null    float64
 4   flipper_length_mm  342 non-null    float64
 5   body_mass_g        342 non-null    float64
 6   sex                333 non-null    object 
 7   year               344 non-null    int64  
dtypes: float64(4), int64(1), object(3)
memory usage: 21.6+ KB
None
species island bill_length_mm bill_depth_mm flipper_length_mm body_mass_g sex year
0 Adelie Torgersen 39.10 18.70 181.00 3,750.00 male 2007
1 Adelie Torgersen 39.50 17.40 186.00 3,800.00 female 2007
2 Adelie Torgersen 40.30 18.00 195.00 3,250.00 female 2007
3 Adelie Torgersen NaN NaN NaN NaN NaN 2007
4 Adelie Torgersen 36.70 19.30 193.00 3,450.00 female 2007

Relationship 1

Relationship 2

Relationship 3

Quantifying the Relationship

  • Covariance - measure of the joint variability of two random variables
  • The sign of the covariance, therefore, shows whether it is positive or negative relationship
  • \(Cov(X,Y)= \frac{\sum_{i=1}^n(x_i - \bar{x})(y_i - \bar{y})}{n}\)
  • The magnitude doesn’t tell you much….we need a way to normalize it….Correlation to the rescue!

Correlation

  • A metric between -1 and +1

  • \(r(X,Y)= \frac{\sum_{i=1}^n(x_i - \bar{x})(y_i - \bar{y})}{\sqrt{\sum_{i=1}^n(x_i - \bar{x})^2 \cdot \sum_{i=1}^n(y_i - \bar{y})}}\)

  • \(r(X,Y)= \frac{Cov(X,Y)}{\sigma_x \cdot \sigma_y}\)

Example Data

data = np.array([
  [1, 2,   -2,     3],
  [2, 4,   -4,     3],
  [3, 3.5, -3.5,   3],
  [4, 7.5, -7.5,   3],
  [5, 10.2, -10.2, 3],
  [6, 12.1, -12.1, 3],
])
cov = np.cov(data, rowvar=False)
print('Cov:', np.array2string(cov, prefix='Cov: ', formatter={'float_kind':lambda x: f"{x:5.1f}"}))
print(np.var(data[:, 0], ddof=1))
print(np.var(data[:, 1], ddof=1))
Cov: [[  3.5   7.3  -7.3   0.0]
      [  7.3  16.3 -16.3   0.0]
      [ -7.3 -16.3  16.3   0.0]
      [  0.0   0.0   0.0   0.0]]
3.5
16.307

Example Correlation Graph

corr = np.corrcoef(data, rowvar=False)
dataplot = sns.heatmap(corr, cmap="vlag", annot=True)

Secret Weapon

  • Now its time to show you my secret weapon
  • Dont tell anyone : )
  • What I am about to show you single handedly landed me an offer to work at a big company in California
  • Now for the story

The Story

Background

  • My job was to predict where on the airport runway the airplane was using cameras
  • Specifally your lateral position on the runway

The Story (Continued)

  • I created a model that predicted cross-track position.
    • \(\hat{CT} = f(\text{FlightState}) = f(\theta, \psi, \phi, \text{image, etc.})\)
  • We had the true CT position (from GPS) to compare my model against. \(Error = \hat{CT} - CT\)
  • It worked great most of the time!
  • However, we kept getting really large errors sometimes
  • No obvious pattern?
  • WHY!?!?!

Data

ct_error roll pitch yaw downtracks crosstracks
0 1.63 7.99 2.55 3.91 0.00 0.00
1 3.33 2.93 -2.10 3.89 4.02 1.10
2 2.43 0.12 -0.72 -0.41 8.03 2.20
3 3.24 -1.19 -2.21 -15.68 12.05 3.30
4 3.16 4.12 -3.75 -5.25 16.06 4.39

Pair Plot

sns.pairplot(df_bad)

More Data!

ct_error roll pitch yaw downtracks crosstracks alt
0 1.63 7.99 2.55 3.91 0.00 0.00 203.27
1 3.33 2.93 -2.10 3.89 4.02 1.10 206.84
2 2.43 0.12 -0.72 -0.41 8.03 2.20 205.51
3 3.24 -1.19 -2.21 -15.68 12.05 3.30 207.36
4 3.16 4.12 -3.75 -5.25 16.06 4.39 207.70

The Error

  • Long story short, the GPS altitude was broken!
  • It was reporting that the airpane was off the ground!
  • My algorithm took into account your height off the ground.
  • At first, my bosses would not beleive me! It was a $10,000 GPS!
  • But the correlation plots and all my subsequent research convinced them

The True Error

  • Someone forgot to renew the subscription service for the High Precision GPS!

Recap EDA

Key Workflow and Graphs

  • Descriptive Statisitcs
    • Means, quartiles, etc. for each feature
  • Histogram of any intresting features
  • Shape of Data
  • Missing Data
  • Find relationship (Correlation)

Class Activity

Class Activity

Work on your Topic Idea!