CISC482 - Lecture05

Probability Inference

Dr. Jeremy Castagno

Class Business

Schedule

  • HW2: Feb 1 @ Midnight, Wednesday
  • Reading 3-1: Feb 3 @ 12PM, Friday
  • HW3: Feb 15 @ Midnight, Wednesday
  • Exam 1: Feb 15 in Class

CS Faculty Candidate

  • Benz Tran is here Friday!
  • Please attend a meet and greet at 3:15 in SBSC 112
  • Extra Credit!

Master Degree

  • Northeastern University’s Roux Institute
  • Tuesday, February 21, 2023, noon to 2 p.m., in the Campus Union
  • Data Science, Computer Science, Project Management, etc.
  • $25,000 scholarships for students who begin their Northeastern University master’s program at The Roux Institute in Fall 2023

Inferential Statistics

Main Ideas

  • Inferential statistics are methods that result in conclusions and estimates about the population based on a sample
  • Seek to estimate the parameters that describe a populations distribution
    • mean, std, etc.
  • Remember, we collect data from a population, this creates a sample
  • Using that sample, we make inferences about the underlying population
  • The sample proportion of voters who plan to vote by mail is a statistic and estimates the parameter, or the population proportion, of all voters who plan to vote by mail.

Warning

We will not go too deeply into this subject. We will only focus on the most important points.

Sampling

  • Because calculated statistics will vary from sample to sample due to natural sampling variability, statistics do not estimate parameters with 100% accuracy.
  • The overall behavior of a statistic from repeated sampling is described by a sampling distribution.
  • The sampling distribution of a statistic describes the statistic’s possible values and a measure of how likely the values are to occur.

Sampling Video

Central Limit Theorem

Tip

The Central Limit Theorem (CLT) states that if random samples of size are drawn from a large population and is large enough, then the sampling distribution of the sample mean will follow approximately a normal distribution.

Hypothesis Testing

Hypothesis Test

  • Hypothesis Test - method for examining a claim, or hypothesis, about a population parameter.
  • null hypothesis, \(H_0\), by-chance, no-effect explanation
    • medicine has no effect
  • alternative hypothesis, \(H_a\), explanation of an effect
    • medicine has a (positive) effect
  • p-value - or likelihood, of obtaining a statistic at least as extreme when \(H_0\) is true.

Caution

Statistics is widely and notoriously misunderstood. Even by experts. Including me.

Visualization

Questions

  1. A graph of the sampling distribution of the sample proportion of correct detections out of 37 trials when the null hypothesis is true is given below. Based on this graph, observing a sample proportion of 0.78 or greater is

  2. Can the dog detect cancer?

Caution

This does not mean the dog detects cancer! This just means the dog is doing better than guessing! Maybe cancer patients eat PB sandwiches and thats what the dog is smelling!

Errors

Type 1 and Type 2 Errors

  • Type 1 Error - is rejecting the null hypothesis in favor of the alternative when in reality the null hypothesis is true.
    • False Positive
  • Type 2 Error - is failing to reject (accepting) the null hypothesis when in reality the alternative hypothesis is true.
    • False Negative

Tip

Binary Outcomes, True or False, 1 or 0

False-Positive = Incorrectly Predict a Positive Outcome

\[ \underbrace{\textbf{False}}_{\textbf{Correct or Incorrect}}-\underbrace{\textbf{Positive}}_{\textbf{Your Prediction}} \]

Table

Actual Positive Actual Negative
Predict Positive TP FP, Type I
Predict Negative FN, Type II TN

Estimation

Confidence Intervals

  • Sometimes you want to estimate the value of a population parameter (e.g., the mean)
  • Confidence Interval provides an interval of possible values for the parameter being estimated
    • estimate +- margin of error
  • Margin of error includes
    • the standard error, or measure of sampling variability
    • Confidence level, or measure of interval reliability. Usually set at 95%.

Example

Standard Deviation of Sampling Distribution

  • We don’t usually have the standard deviation of sampling distribution.
  • Estimate with the Standard Error
  • \(SD_{\hat{p}} = SD_{\bar{x}} = \sigma_{\bar{x}} = SEM\)
  • \(SD_{\bar{p}} = \frac{\sigma_x}{\sqrt{N}}\)
    • \(\sigma_x\) - This is the standard deviation of your samples
    • \(N\) - How many samples you took

Tip

Use standard error when estimating means.

Inference for proportions and means

Confirming reported statistic

  • Given a statistic about a population, \(\hat{\pi}\). Mean radon levels of houses in Iowa.
  • You gather samples that are IID. Independent and identically distributed
  • Compute the mean and standard deviation from your sample: \(\hat{p}, \hat{\sigma}\)
  • \(H_0\): The true population mean is \(\hat{\pi}\). \(\pi = \hat{\pi}\)
  • \(H_a\): The true population mean is not \(\hat{\pi}\). \(\pi \neq \hat{\pi}\)

Procedure

Z-table

Z Table

Caution

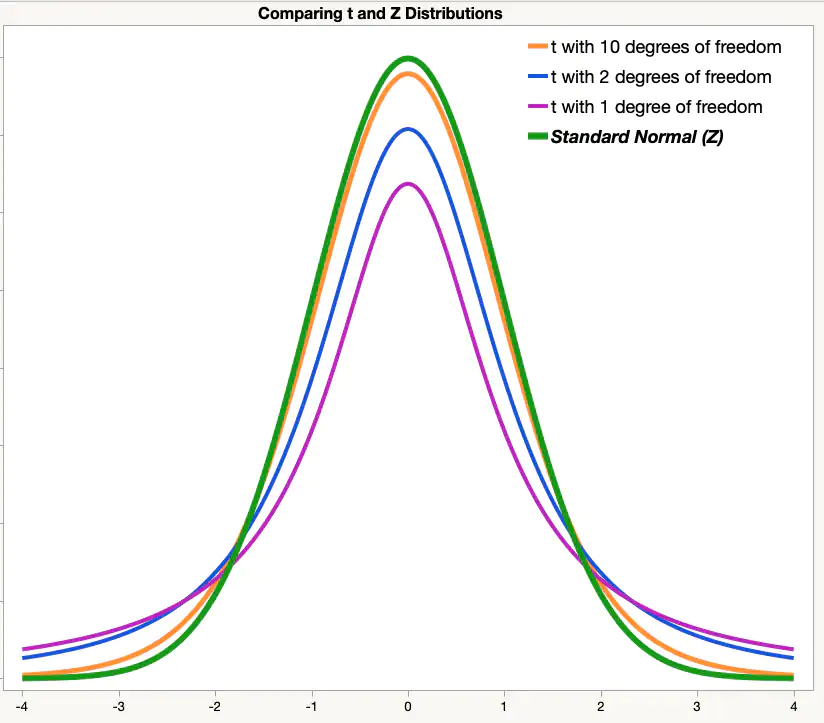
What if we didn’t gather that many samples, e.g., \(< 30\)? Then our sampling distribution follows a t-distribution.

T vs Normal Distribution

T-table

Link

Conclusion

Highlights

  • Inferential statistics are methods that result in conclusions and estimates about the population based on a sample
  • Hypothesis Testing - create a null hypothesis, gather data, compute sample statistics, compute z-score and generate p-value.
  • Confidence Interval - sample data, compute sample statistics, use confidence multiplier (z-value) and standard deviation of samples to compute margin of error

Whats next?

  • Start playing more with data!
  • Will be using the software pandas to help analyze the data
  • Cleaning data