CISC482 - Lecture03

Statistics

Dr. Jeremy Castagno

Class Business

Schedule

  • Reading 2-1: Jan 25 @ 12PM, Wed
  • Reading 2-2: Jan 27 @ 12PM, Friday
  • Reading 2-3: Feb 1 @ 12PM, Wed
  • HW2: Feb 1 @ Midnight, Wed

Data Collection

Stats for data science

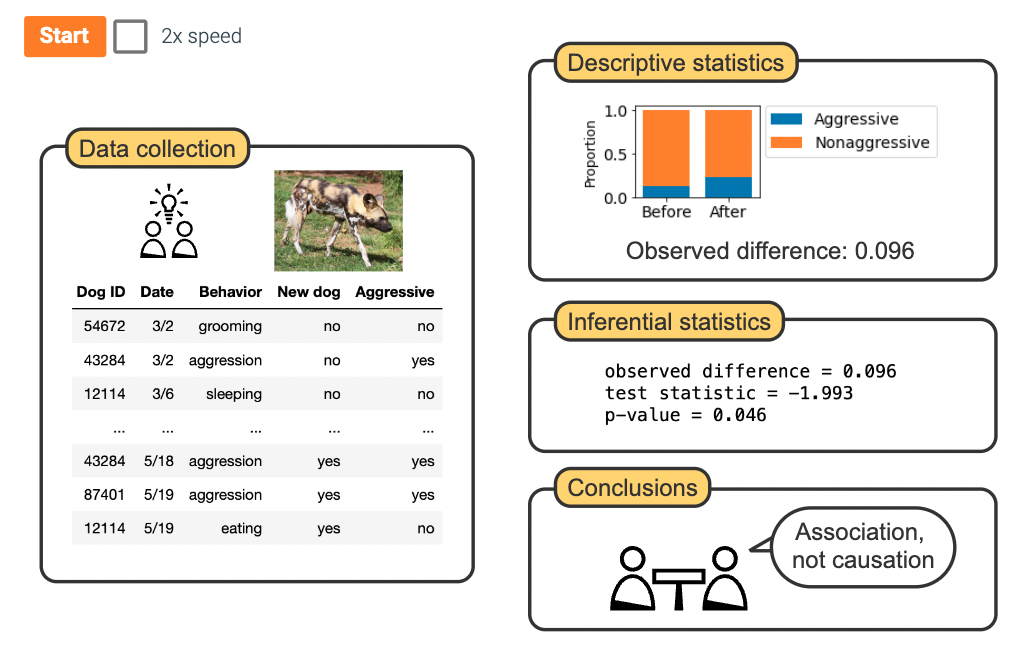
  • Data science relies on statistics to make data driven decisions
  • Sampling methods are used to efeciently collect data and reduce bias

Note

Bias - anything that leads to a systematic difference between the true parameters of a population and the statistics used to estimate those parameters. E.g., sampling only men.
It’s hard…

Sampling Errors

  • A small, systematic polling error made a big difference
  • All polls were off in the same direction (5 pts) in swing states
  • Correlatated sampling errors in the midwest
  • Failure to appreciate uncertainty

Stats for data science

  • Descriptive statistics -> explore visualizations
  • Inferential statistics -> modeling and estimation
  • Statisitcs is foundational to ensure results are interpreted correctly

Sampling

  • Population - Entire set of individuals, items, or events of interest
  • Observational Unit - individual item or event
  • Sample - subset of observational units from the population

Types of Sampling

  • Random Sampling
    • OU are selected at random
  • Stratified Sampling
    • Population is divided into groups (primary feature). Each group is sampled.
  • Cluster Sampling
    • Population divided into groups (not a primary feature, geography)
  • Systematic Sampling
    • Every k’th observational unit is sampled
  • Convenience Sampling
    • OU are selected that are easier

Observational vs Experiement

  • Observational
    • Observing or collecting data
    • Not trying to control or influence an outcome
  • Experimental
    • You are controlling a varaible
    • You manipulate that variable to get a different response

Descriptive Statistics

Oveview

  • Terminology
  • Measure of center
  • Measure of spread
  • Measure of position
  • Measure of shape

Terminology

  • Descriptive Statistics - summarize and describe a features important characteristics
  • distribution - the possible values the feature can take
  • cluster - a distinct group of neighboring values in a distribution
  • tails - the end values of a distributution

Terminology - Visualized

Measure of Center

  • Mean - average, sum of all values divided by the total number of values, n \[ \frac{1}{n} \sum_{i=i}^{n} x_{i} \]
  • Median - the middle value of the ordered data

Code Example!

heights = [5.5, 5.7, 5.8, 5.9]
avg_height = sum(heights) / len(heights)
print(f"Average Height: {avg_height:.2f}")
Average Height: 5.72


Using Numpy

import numpy as np
heights = np.array([5.5, 5.7, 5.8, 5.9, 6.2])
avg_height = np.average(heights)
print(f"Average Height: {avg_height:.2f}")
Average Height: 5.82

What is NumPy

  • NumPy is the fundamental package for scientific computing in Python.
  • Python library that provides a multidimensional array object.
  • Stores data very effeciently very fast
a = np.array([1, 2])

2D array - rows and columns

b = np.array([
  [1, 2], # first row
  [3, 4]  # second row
])

Question

np.average(...) - finds the average

Tip

What function to get the median?

heights = np.array([5.5, 5.7, 5.8, 5.9, 6.2])
median_height = np.median(heights)
print(f"Median Height: {median_height:.2f}")
Median Height: 5.80

Descriptive Stats

Spread

Spread Terminology

  • range - distance between the min and max
  • interquartile range (IQR) - range of the middle 50%
  • variance - the average squared distance between a feature and its discribution mean

\[ \sigma^2 = Var(x) = \frac{\sum_{i=1}^{n} (x_i - \bar{x} )^2}{n-1} \]

  • Standard deviation - \(\sigma = sqrt(Var(X))\)

Postion Terminology (Quantiles)

Example

Measures of Shape

  • Skewness - measure of the amount and direction of skew
  • Kurtosis - measure of tail heaviness

Code

Mean

                            # mean,  std,    n
samples = np.random.normal(loc=5.0, scale=1, size=11)
samples
array([6.624, 4.388, 4.472, 3.927, 5.865, 2.698, 6.745, 4.239, 5.319,
       4.751, 6.462])

How would I get the mean?

print(np.mean(samples))
5.044609002634907

Standard Deviation

std = np.std(samples)
print(f"The standard deviation is: {std:.2f}")
The standard deviation is: 1.22

The variance?

var = std * std
print(f"The variance is: {var:.2f}")
The variance is: 1.49

Quantiles

samples_sorted = np.sort(samples)
print(samples_sorted)
[2.698 3.927 4.239 4.388 4.472 4.751 5.319 5.865 6.462 6.624 6.745]

Getting the quantile

fifty_percent_quantile = np.quantile(samples, 0.50)
median = np.median(samples)

print(f"{fifty_percent_quantile:.3f}")
print(f"{median:.3f}")
4.751
4.751
quantiles = np.quantile(samples, [0.25, 0.5, 0.75])

print(quantiles)
[4.314 4.751 6.164]

Shape

Advanced statistics -> I recommend using the library scipy. This library is built on top of numpy but has more functionality.

from scipy.stats import skewnorm
samples_skewed = skewnorm.rvs(3, loc=15, scale=2, size=1000)
samples = skewnorm.rvs(0, loc=5, scale=1, size=1000)

Skewness and Kurtosis

Calculate the skewness

import scipy.stats as stats
print(f"Skewed sample data set, skewnewss is: {stats.skew(samples_skewed):.3f}")
print(f"Normal sample data set, skewnewss is: {stats.skew(samples):.3f}")
Skewed sample data set, skewnewss is: 0.790
Normal sample data set, skewnewss is: -0.003

Calculate the kurtosis

import scipy.stats as stats
print(f"Skewed sample data set, kurtosis is: {stats.kurtosis(samples_skewed):.3f}")
print(f"Normal sample data set, kurtosis is: {stats.kurtosis(samples):.3f}")
Skewed sample data set, kurtosis is: 0.938
Normal sample data set, kurtosis is: -0.067

Warning

This skewed distribution is not very good at demonstrating kurtosis.

All

import scipy.stats as stats
stats.describe(samples)
DescribeResult(nobs=1000, minmax=(1.7616568032476234, 7.787361447950662), mean=5.053665979218166, variance=1.0126662448100565, skewness=-0.0026145821525120016, kurtosis=-0.06654059199852824)